Data Science Weekly - Issue 547
Curated news, articles and jobs related to Data Science, AI, & Machine Learning
Issue #547
May 16, 2024
Hello!
Once a week, we write this email to share the links we thought were worth sharing in the Data Science, ML, AI, Data Visualization, and ML/Data Engineering worlds.
And now…let's dive into some interesting links from this week.
Editor's Picks
100 Exercises To Learn Rust
This course will teach you Rust's core concepts, one exercise at a time. You'll learn about Rust's syntax, its type system, its standard library, and its ecosystem. We don't assume any prior knowledge of Rust, but we assume you know at least another programming language. We also don't assume any prior knowledge of systems programming or memory management. Those topics will be covered in the course. In other words, we'll be starting from scratch! You'll build up your Rust knowledge in small, manageable steps. By the end of the course, you will have solved ~100 exercises, enough to feel comfortable working on small to medium-sized Rust projects…
Databases for Data Scientist - And why you probably don’t need one
It’s been coming up a lot recently, or, maybe, I’ve just been focused on this a lot more. Data scientists are coming to terms with the fact that they have to work with databases if they want their analytics to scale. That is pretty normal. But one of the bigger challenges is that these data scientists don’t really know how to make that leap. What do they need to know to make that transition?…Data Wrangler Extension for Visual Studio Code
Data Wrangler is a code-centric data viewing and cleaning tool that is integrated into VS Code and VS Code Jupyter Notebooks. It provides a rich user interface to view and analyze your data, show insightful column statistics and visualizations, and automatically generate Pandas code as you clean and transform the data. The following is an example of opening Data Wrangler from the notebook to analyze and clean the data with the built-in operations. Then the automatically generated code is exported back into the notebook…
A Message from this week's Sponsor:
Metabase: Setting the Standard for Self-Service BI
Metabase: Setting the Standard for Self-Service BI
Discover the power of intuitive data analysis with Metabase, the BI tool designed for everyone in your organization. From startups to large enterprises, Metabase makes data-driven decision-making accessible without the need for complex technical skills. Key features:
Easy Integration: Connects effortlessly with major data systems including MySQL, PostgreSQL, and MongoDB.
User-Friendly: No SQL knowledge required. Create dashboards and reports through a straightforward drag-and-drop interface.
Flexible Hosting: Choose from self-hosted or cloud-hosted options, both ensuring top-tier security with SOC 2 Type II compliance.
Scalable Solutions: Perfect for venture-backed startups and used by over 50,000 organizations worldwide.
Cost-Effective: Start with a free trial and discover our affordable plans designed to fit your budget.
Empower your team to harness the full potential of their data with Metabase. Start your free trial today and join thousands of businesses transforming their data into actionable insights. See for yourself how Metabase can streamline your analytics—start for free today.
* Want to sponsor the newsletter? Email us for details --> team@datascienceweekly.org
Data Science Articles & Videos
10 Minutes to RAPIDS cuDF's pandas accelerator mode (cudf.pandas)
cuDF is a Python GPU DataFrame library (built on the Apache Arrow columnar memory format) for loading, joining, aggregating, filtering, and otherwise manipulating tabular data using a DataFrame style API in the style of pandas. cuDF now provides a pandas accelerator mode (cudf.pandas), allowing you to bring accelerated computing to your pandas workflows without requiring any code change. This notebook is a short introduction to cudf.pandas….The Platonic Representation Hypothesis
Conventionally, different AI systems represent the world in different ways. A vision system might represent shapes and colors, a language model might focus on syntax and semantics. However, in recent years, the architectures and objectives for modeling images and text, and many other signals, are becoming remarkably alike. Are the internal representations in these systems also converging? We argue that they are, and put forth the following hypothesis: Neural networks, trained with different objectives on different data and modalities, are converging to a shared statistical model of reality in their representation spaces…Why is AI for medical imaging, such as histopathology, such a saturated area? And why is AI for molecular biology (other than protein folding) then so underexplored? [Reddit]
I work on projects involving AI for biomedical research, and something that shocks me is why there are so many papers/projects involving AI for medical imaging, especially computational pathology (or radiology)? Is it because of the demand in this area (i.e. histopathology for hospitals doing biopsies on patients)?…LLM Training Puzzles
This is a collection of 8 challenging puzzles about training large language models (or really any NN) on many, many GPUs. Very few people actually get a chance to train on thousands of computers, but it is an interesting challenge and one that is critically important for modern AI. The goal of these puzzles is to get hands-on experience with the key primitives and to understand the goals of memory efficiency and compute pipelining…Welcome To The Parallel Future of Computation
With Bend you can write parallel code for multi-core CPUs/GPUs without being a C/CUDA expert with 10 years of experience. It feels just like Python! No need to deal with the complexity of concurrent programming: locks, mutexes, atomics... any work that can be done in parallel will be done in parallel…blueycolors
blueycolors provides color palettes and ggplot2 color and fill scales inspired by Bluey…InGARSS'23 Tutorial-1: Monitoring Land Use Land Cover Changes with GEE, by Ujaval Gandhi
Welcome to the exclusive tutorial session from IEEE InGARSS featuring Ujaval Gandhi, Founder of Spatial Thoughts. In this session, Ujaval delves into the fascinating realm of "Monitoring Land Use Land Cover Changes with Google Earth Engine."…The Sweet Spot - Maximizing Llama Energy Efficiency
tldr: limit your GPUs to about 2/3rd of maximum power draw for the least Joules consumed per token generated without speed penalty…Formatted spreadsheets can still work in R - It’s not too late
This recent post by Jeremy Selva shows a nice workflow for working with problematic formatted spreadsheets in R. I’ve worked on this topic before, so I when I saw the post I had to meddle. I suggested using functions from the unheadr package to address some of these issues. They didn’t work because of assumptions I hard-coded into the package, but these are fixed now. These fixes are part of unheadr v0.4.0. To demonstrate the functions and also to celebrate 20k downloads (🥳), here is my take (with the benefit of hindsight) on tackling this troublesome spreadsheet…
Langtrace - Open Source & Open Telemetry(OTEL) Observability for LLM applications
Langtrace is an open source observability software which lets you capture, debug and analyze traces and metrics from all your applications that leverages LLM APIs, Vector Databases and LLM based Frameworks. image Open Telemetry Support The traces generated by Langtrace adhere to Open Telemetry Standards(OTEL). We are developing semantic conventions for the traces generated by this project…Using NumPy reshape() to Change the Shape of an Array
The main data structure that you’ll use in NumPy is the N-dimensional array. An array can have one or more dimensions to structure your data. In some programs, you may need to change how you organize your data within a NumPy array. You can use NumPy’s reshape() to rearrange the data. The shape of an array describes the number of dimensions in the array and the length of each dimension. In this tutorial, you’ll learn how to change the shape of a NumPy array to place all its data in a different configuration. When you complete this tutorial, you’ll be able to alter the shape of any array to suit your application’s needs…AI TutoR
Very excited to introduce "AI TutoR", our new PsyTeachR book that teaches students how to use AI as a personalised tutor. Whilst there is a set of chapters about using AI to write #rstats code, we also show how to use #AI for any course…
A Message from this week's other Sponsor:
See your dataset through your model's eyes with 3LC
See your dataset through your model's eyes with 3LC
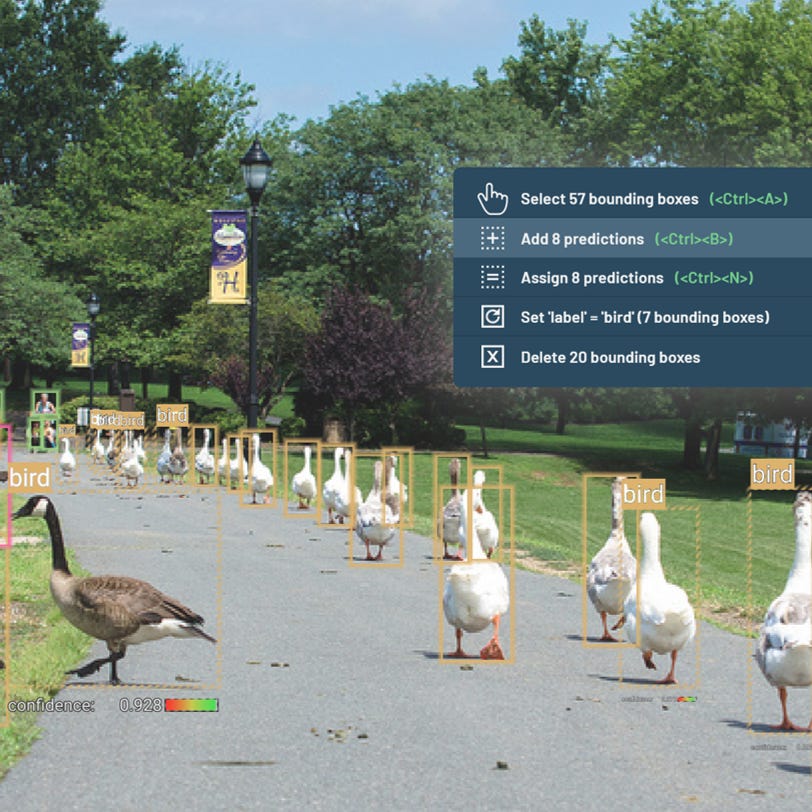
Have you ever found yourself exhausted from tweaking ML hyperparameters in an effort to enhance your model, only to find that it still doesn't meet your expectations no matter what you do? Often, the root cause isn't the hyperparameters but rather the quality of the data your model is trained on. 3LC offers a comprehensive solution that enables you to easily identify issues with your dataset, correct them (e.g., label editing, balancing data with weights), and retrain your model using the improved data. Try out 3LC for free during our beta period to enlighten your ML practices.
Visit https://3lc.ai/ to learn more.
* Want to sponsor the newsletter? Email us for details --> team@datascienceweekly.org
Training & Resources
Special Topics in DS - Causal Inference in Machine Learning
Recent advances and successes in machine learning have had tremendous impacts on society. Despite such impact and successes, the currently dominant paradigm of machine learning, broadly represented by deep learning, relies almost entirely on capturing statistical correlations among features from data. As the famous phrase “correlation does not imply causation” suggests, such correlation-driven approaches cannot uncover causal relationships among variables of interest. In this introductory course, we aim to provide early-year M.Sc. and Ph.D students, who are already familiar with machine learning, with the foundational ideas and techniques in causal inference so that they can expand their knowledge and expertise beyond correlation-driven machine learning…
CMU Advanced NLP Spring 2024
CS11-711 Advanced Natural Language Processing (at Carnegie Mellon University’s Language Technology Institute) is an introductory graduate-level course on natural language processing aimed at students who are interested in doing cutting-edge research in the field. In it, we describe fundamental tasks in natural language processing such as syntactic, semantic, and discourse analysis, as well as methods to solve these tasks. The course focuses on modern methods using neural networks, and covers the basic modeling and learning algorithms required therefore…Fumbling Into Floats - some poking around with small number representations in Python
Recently, I was working on a side project writing a multi-armed bandit simulator from scratch. Part of the code requires iteratively appending to a series of numbers and calculating the mean. It turns out that instead recalculating the mean over the entire series each time you can use a more computationally efficient incremental mean. Here what that looks like in Python…
Last Week's Newsletter's 3 Most Clicked Links
Interpretable time-series modelling using Gaussian processes
I dislike Azure and 'low-code' software, is all DE like this? [Reddit]
* Based on unique clicks.
** Find last week's issue #546 here.
Cutting Room Floor
See to Touch: Learning Tactile Dexterity through Visual Incentives
Dream2DGS: tool for text/image to 3D generation based on 2D Gaussian Splatting and DreamGaussian
BEHAVIOR Vision Suite: Customizable Dataset Generation via Simulation
Does Fine-Tuning LLMs on New Knowledge Encourage Hallucinations?
Shaping Human-AI Collaboration: Varied Scaffolding Levels in Co-writing with Language Models
People cannot distinguish GPT-4 from a human in a Turing test
Word2World: Generating Stories and Worlds through Large Language Models
Arctic-Embed: Scalable, Efficient, and Accurate Text Embedding Models
Whenever you're ready, 2 ways we can help:
Looking to get a job? Check out our “Get A Data Science Job” Course
It is a comprehensive course that teaches you everything related to getting a data science job based on answers to thousands of emails from readers like you. The course has 3 sections: Section 1 covers how to get started, Section 2 covers how to assemble a portfolio to showcase your experience (even if you don’t have any), and Section 3 covers how to write your resume.Promote yourself/organization to ~62,000 subscribers by sponsoring this newsletter. 35-45% weekly open rate.
Thank you for joining us this week! :)
Stay Data Science-y!
All our best,
Hannah & Sebastian


