Data Science Weekly - Issue 571
Curated news, articles and jobs related to Data Science, AI, & Machine Learning
Issue #571
October 31, 2024
Happy Halloween!
Happy Diwali!
Happy Diwali-ween!
Hello!
Once a week, we write this email to share the links we thought were worth sharing in the Data Science, ML, AI, Data Visualization, and ML/Data Engineering worlds.
And now…let's dive into some interesting links from this week.
Editor's Picks
Moving to a World Beyond “p < 0.05”
Some of you exploring this special issue of The American Statistician might be wondering if it’s a scolding from pedantic statisticians lecturing you about what not to do with p-values, without offering any real ideas of what to do about the very hard problem of separating signal from noise in data and making decisions under uncertainty. Fear not. In this issue, thanks to 43 innovative and thought-provoking papers from forward-looking statisticians, help is on the way…
Scorigami: Visualize Every NFL Score Ever
A scorigami is a final score that has never happened before in the history of the NFL. The term was coined by Jon Bois and narrated in a 2017 video called Every NFL Score Ever (highly recommended, Jon Bois is one of best storytellers out there!). Since then, scorigami has entered the football lexicon and has become a fun way to track the history of the NFL. This visualization is our take on scorigami, designed to be fun and exploratory. You can see every final NFL score in history, how many times each has happened, and slice the data in various ways…Vector Databases Are the Wrong Abstraction
Vector databases treat embeddings as independent data, divorced from the source data from which embeddings are created, rather than what they truly are: derived data. By treating embeddings as independent data, we’ve created unnecessary complexity for ourselves…In this post, we'll propose a better way: treating embeddings more like database indexes through what we call the "vectorizer" abstraction. This approach automatically keeps embeddings in sync with their source data, eliminating the maintenance costs that plague current implementations…
A Sponsor Message
Get easy-to-use business intelligence for your startup
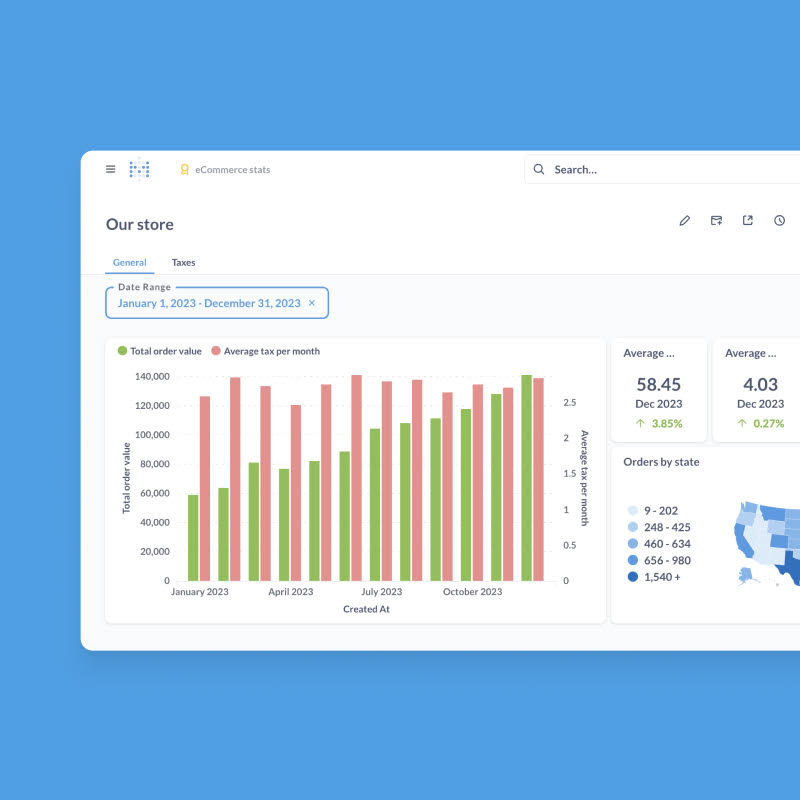
Metabase’s intuitive BI tools empower your team to effortlessly report and derive insights from your data. Compatible with your existing data stack, Metabase offers both self-hosted and cloud-hosted (SOC 2 Type II compliant) options. In just minutes, most teams connect to their database or data warehouse and start building dashboards—no SQL required. With a free trial and super affordable plans, it's the go-to choice for venture-backed startups and over 50,000 organizations of all sizes. Empower your entire team with Metabase. Read more.
.
* Want to sponsor the newsletter? Email us for details --> team@datascienceweekly.org
Data Science Articles & Videos
Error bars - The meaning of error bars is often misinterpreted, as is the statistical significance of their overlap
Last month in Points of Significance, we showed how samples are used to estimate population statistics. We emphasized that, because of chance, our estimates had an uncertainty…This month we focus on how uncertainty is represented in scientific publications and reveal several ways in which it is frequently misinterpreted. The uncertainty in estimates is customarily represented using error bars. Although most researchers have seen and used error bars, misconceptions persist about how error bars relate to statistical significance..Who here uses PCA and feels like it gives real lift to model performance? [Reddit Discussion]
I can see value in it if I were using linear or logistic regression, but I’d only use those models if it was an extremely simple problem or if determinism and explain ability are critical to my use case. However, this of course defeats the value of PCA because it eliminates the explainability of its coefficients or shap values…What are others’ thoughts on this? Maybe it could be useful for real time or edge models if it needs super fast inference and therefore a small feature space?…Dispelling myths about randomisation
When we are interested in cause and effect relationships (which is much of the time!) we have two options: We can simply observe the world to identify associations between X and Y, or we can randomise people to different levels of X and then measure Y…The former – observational methods – generally provides us with only a weak basis for inferring causality at best…But when we can randomise, that gives us remarkable inferential power…I want to dispel a couple of common but persistent myths…Building a better and scalable system for data migrations
I've been thinking about what a better solution to data migrations might look like for a while, so let's explore my current thoughts on the subject…OLMo: Accelerating the Science of Language Modeling (COLM)
Language models (LMs) have become ubiquitous in both AI research and commercial product offerings…In this talk, I present our OLMo project aimed at building strong language models and making them fully accessible to researchers along with open-source code for data, training, and inference. I describe our efforts in building language modeling from scratch, expanding their scope to make them applicable and useful for real-world applications, and investigating a new generation of LMs that address fundamental challenges inherent in current models…How to Correctly Sum Up Numbers
When you learn programming, one of the first things every book and course teaches is how to add two numbers. So, developers working with large data probably don't have to think too much about adding numbers, right? Turns out it's not quite so simple!…AlignEval is a game/tool to help you build and optimize LLM-evaluators
We do so by aligning annotators to AI output, and aligning AI to annotator input. To progress, gain XP by adding labels while you look at your data…Why are ML Compilers so Hard?
Even before the first version of TensorFlow was released, the XLA project was integrated as a “domain-specific compiler” for its machine learning graphs. Since then there have been a lot of other compilers aimed at ML problems, like TVM, MLIR, EON, and GLOW. They have all been very successful in different areas, but they’re still not the primary way for most users to run machine learning models. In this post I want to talk about some of the challenges that face ML compiler writers, and some approaches I think may help in the future…Efficient Machine Learning with R
Welcome to Efficient Machine Learning with R! This is a book about predictive modeling with tidymodels, focused on reducing the time and memory required to train machine learning models without sacrificing predictive performance…
Every Bit Counts, a Journey Into Prometheus Binary Data
It was day five of what I thought would be a fun two-day side project, and I had identified a small bug. Was my code wrong, or the original code running on millions of computers for years wrong? I blamed my code, it’s almost always my code. However, after too many hours of debugging, I eventually found the bug in the original code…Creating a LLM-as-a-Judge That Drives Business Results
A step-by-step guide with my learnings from 30+ AI implementations…Probability-Generating Functions
I have long struggled with understanding what probability-generating functions are and how to intuit them. There were two pieces of the puzzle missing for me, and we’ll go through both in this article…if you’ve ever heard the term pgf or characteristic function and you’re curious what it’s about, hop on for the ride!…Building Reproducible Analytical Pipelines
This course is my take on setting up code that results in some data product. This code has to be reproducible, documented and production ready. Not my original idea, but introduced by the UK’s Analysis Function…The basic idea of a reproducible analytical pipeline (RAP) is to have code that always produces the same result when run, whatever this result might be. This is obviously crucial in research and science, but this is also the case in businesses that deal with data science/data-driven decision making etc…A well documented RAP avoids a lot of headache and is usually re-usable for other projects as well…
.
Last Week's Newsletter's 3 Most Clicked Links
* Based on unique clicks.
** Find last week's issue #570 here.
Cutting Room Floor
What it is like to maintain the scikit-learn docs with David Arturo Amor Quiroz, docs maintainer
Vincent D. Warmerdam - Run a benchmark they said. It will be fun they said
Control a web browser from R to web scrap static and dynamic websites using {chromote}
Averaging is a convenient fiction of neuroscience
.
Whenever you're ready, 3 ways we can help:
Learning something for your job? We can help you. Hit reply to get started.
Looking to get a job? Check out our “Get A Data Science Job” Course
It is a comprehensive course that teaches you everything related to getting a data science job based on answers to thousands of emails from readers like you. The course has 3 sections: Section 1 covers how to get started, Section 2 covers how to assemble a portfolio to showcase your experience (even if you don’t have any), and Section 3 covers how to write your resume.Promote yourself/organization to ~64,300 subscribers by sponsoring this newsletter. 35-45% weekly open rate.
Thank you for joining us this week! :)
Stay Data Science-y!
All our best,
Hannah & Sebastian


