Data Science Weekly - Issue 624
Curated news, articles and jobs related to Data Science, AI, & Machine Learning
Issue #624
November 06, 2025
Hello!
Once a week, we write this email to share the links we thought were worth sharing in the Data Science, ML, AI, Data Visualization, and ML/Data Engineering worlds.
And now…let's dive into some interesting links from this week.
Editor's Picks
Continuous reinvention: A brief history of block storage at AWS
Marc Olson has been part of the team that has shaped Elastic Block Store (EBS) for over a decade. In that time, he has helped drive the dramatic evolution of EBS from a simple block storage service relying on shared drives to a massive network storage system that delivers over 140 trillion daily operations. In this post, Marc provides a fascinating insider’s perspective on the journey of EBS. He shares hard-won lessons in areas such as queueing theory, the importance of comprehensive instrumentation, and the value of incrementalism versus radical changes…
Think Linear Algebra
Think Linear Algebra is a code-first, case-based introduction to the most widely used concepts in linear algebra, designed for readers who want to understand and apply these ideas — not just learn them in the abstract. Each chapter centers on a real-world problem like modeling traffic in the web, simulating flocking birds, or analyzing electrical circuits. Using Python and powerful libraries like NumPy, SciPy, SymPy, and NetworkX, readers build working solutions that reveal how linear algebra provides elegant, general-purpose tools for thinking and doing…Show HN: I scraped 3B Goodreads reviews to train a better recommendation model
For the past couple of months, I’ve been working on a website with two main features: a) put in a list of books and get recommendations on what to read next from a model trained on over a billion reviews, and b) put in a list of books and find the users on Goodreads who have read them all…
.
What’s on your mind
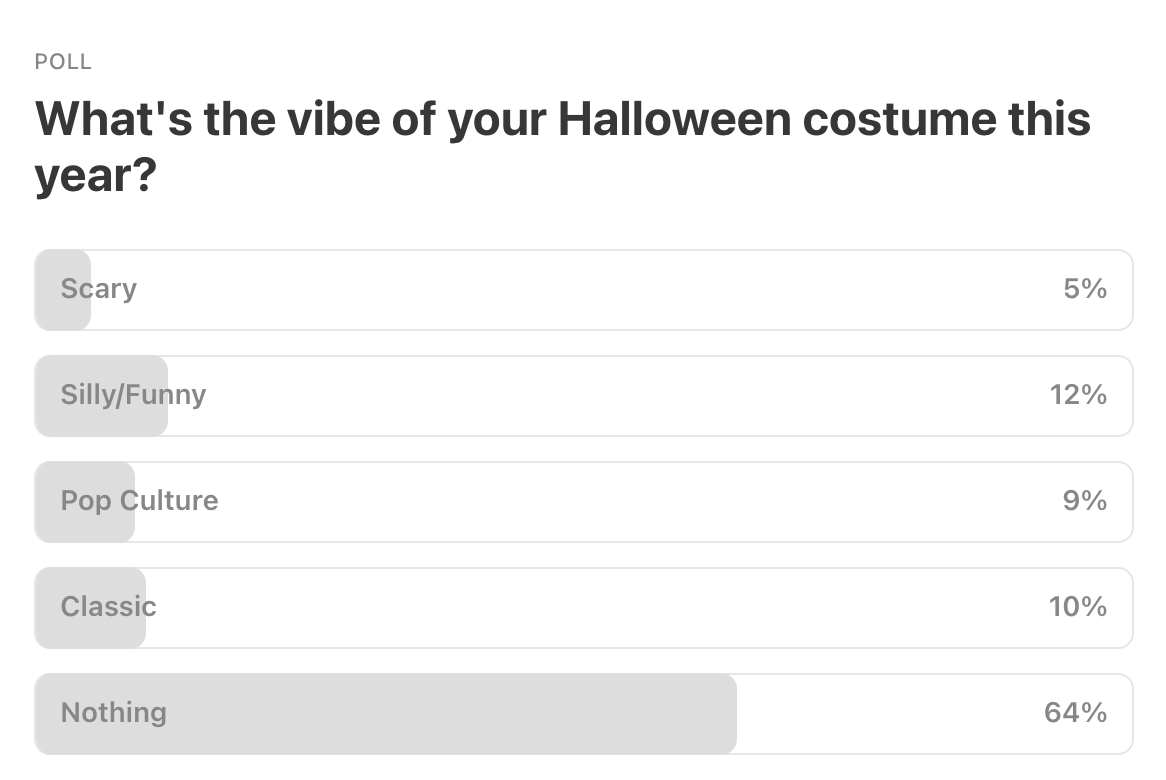
This Week’s Poll:
.
Last Week’s Poll:
.
Featured Message
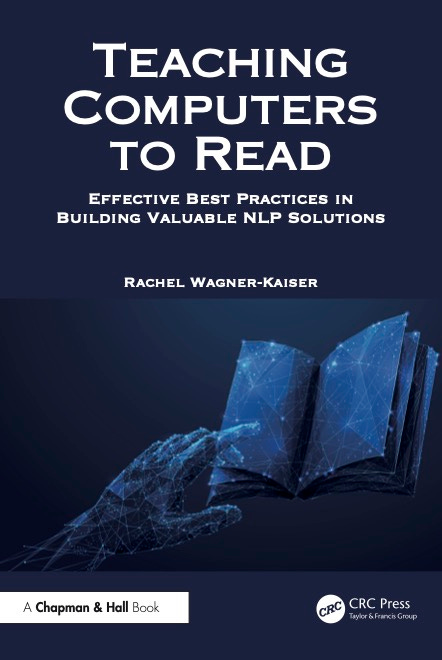
“Teaching Computers to Read”: New book for practical AI and NLP solutions
Successful AI solutions aren’t about chasing the newest model - it’s about solving the right problems in the right way. “Teaching Computers to Read” (out November 5 from CRC Press) focuses on what technical teams need to design, develop, deploy, and maintain useful NLP and AI solutions. Drawing on real-world experience and examples, the book offers actionable best practices to deliver adaptable, reliable AI systems that address business challenges with lasting, tangible value. Check out the code companion for hands-on practice! Learn more or check out the book on Amazon.
.
* Want to be featured in the newsletter? Email us for details --> team@datascienceweekly.org
Data Science Articles & Videos
A Stable Lasso
The Lasso has been widely used as a method for variable selection, valued for its simplicity and empirical performance. However, Lasso’s selection stability deteriorates in the presence of correlated predictors. Several approaches have been developed to mitigate this limitation. In this paper, we provide a brief review of existing approaches, highlighting their limitations. We then propose a simple technique to improve the selection stability of Lasso by integrating a weighting scheme into the Lasso penalty function, where the weights are defined as an increasing function of a correlation-adjusted ranking that reflects the predictive power of predictors…Is R Shiny still a thing? [Reddit]
When I first heard of R Shiny a decade or more ago, it was all the rage, but it quickly died out. Now I’m only hearing about Tableau, Power BI, maybe Looker, etc. So, in your opinion, is learning Shiny a good use of time, or is my University simply out of touch or too cheap to get licenses for the tools people really use?..
Difference in difference
Difference in differences is a very old technique, and one of the first applications of this method was done by John Snow, who’s also popular due to the cholera outbreak data visualization. In his study, he used the Difference in Difference (DiD) method to provide some evidence that, during the London cholera epidemic of 1866, cholera was caused by drinking from a water pump. This method has been more recently used by Card and Krueger in this work to analyze the causal relationship between minimum wage and employment…Moving beyond noninformative priors: why and how to choose weakly informative priors in Bayesian analyses
Here, I hope to encourage the use of weakly informative priors in ecology and evolution by providing a ‘consumer’s guide’ to weakly informative priors. The first section outlines three reasons why ecologists should abandon noninformative priors: 1) common flat priors are not always noninformative, 2) noninformative priors provide the same result as simpler frequentist methods, and 3) noninformative priors suffer from the same high type I and type M error rates as frequentist methods. The second section provides a guide for implementing informative priors, wherein I detail convenient ‘reference’ prior distributions for common statistical models (i.e. regression, ANOVA, hierarchical models)…RAG with Ollama and ragnar in R: A Practical Guide for R Programmers
Learn how to build a privacy-preserving Retrieval-Augmented Generation (RAG) workflow in R using Ollama and the ragnar package. Discover step-by-step methods for summarizing health insurance policy documents, automating compliance reporting, and leveraging local LLMs—all within your R environment…pg_lake: Postgres for Iceberg and Data lakes
pg_lake integrates Iceberg and data lake files into Postgres. With the pg_lake extensions, you can use Postgres as a stand-alone lakehouse system that supports transactions and fast queries on Iceberg tables, and can directly work with raw data files in object stores like S3….Writing a book with Quarto
Turn a collection of RMarkdown documents into a book in <1 hour using Quarto…Polars and Pandas - Working with the Data-Frame
What we’ll do here is compare the Pandas and Polars syntax for some standard data-manipulation code. We will also introduce a new bit of syntax that Pandas 3.0 will be introducing soon…An Interpretability Illusion for BERT
We describe an “interpretability illusion” that arises when analyzing the BERT model. Activations of individual neurons in the network may spuriously appear to encode a single, simple concept, when in fact they are encoding something far more complex. The same effect holds for linear combinations of activations. We trace the source of this illusion to geometric properties of BERT’s embedding space as well as the fact that common text corpora represent only narrow slices of possible English sentences…
How to Analyze bluesky Posts and Trends with R
You can’t download all two billion posts, but you can download a whole lot more than you ever could scrolling. And you can use that data to look for patterns. For example, what if we took a look at 100,000 posts from the last day?..An Introduction to Writing Your Own ggplot2 Geoms
If you use ggplot2, you are probably used to creating plots with geom_line() and geom_point(). You may also have ventured into to the broader ggplot2 ecosystem to use geoms like geom_density_ridges() from ggridges or geom_signif() from ggsignif. But have you ever wondered how these extensions were created? Where did the authors figure out how to create a new geom? And, if the plot of your dreams doesn’t exist, how would you make your own? Enter the exciting world of creating your own ggplot2 extensions…
Why do ML teams keep treating infrastructure like an afterthought? [Reddit]
Genuine question from someone who’s been cleaning up after data scientists for three years now. They’ll spend months perfecting a model, then hand us a Jupyter notebook with hardcoded paths and say, “Can you deploy this?” No documentation. No reproducible environment. Half the dependencies aren’t even pinned to versions. Last week, someone tried to push a model to production that only worked on their specific laptop because they’d manually installed some library months ago and forgot about it. Took us four days to figure out what was even needed to run the thing. I get that they’re not infrastructure people. But at what point does this become their problem too? Or is this just what working with ml teams is always going to be like?…Weighted Quantile Weirdness and Bugs
At some point in their career, many statisticians learn that calculating a quantile can be surprisingly complicated…Different software packages like SAS or R each offer at least a half-dozen ways to compute quantiles, with subtle differences. That’s why I often see data analysts surprised by the fact that their preferred software package spits out a different estimate for the median compared to someone else’s software…Things get still more complicated once you introduce weights, like when you’re analyzing data from a survey sample. This post explains why quantile estimation in general is tricky, and it highlights some troubling surprises in open-source software packages that compute weighted quantiles. It goes on to provide some suggestions for how to define weighted quantiles and fix the issues we see in software packages, and includes a small simulation study to see whether the proposed idea has any promise…
.
Last Week's Newsletter's 3 Most Clicked Links
.
* Based on unique clicks.
** Find last week's issue #623 here.
Cutting Room Floor
A treasure trove of biotech and early SV oral histories by Sally Hughes
Append-Only Object Storage: The Foundation Behind Cheap Bucket Forking
.
Whenever you're ready, 2 ways we can help:
Looking to get a job? Check out our “Get A Data Science Job” Course
It is a comprehensive course that teaches you everything you need to know about getting a data science job, based on answers to thousands of reader emails like yours. The course has three sections: Section 1 covers how to get started, Section 2 covers how to assemble a portfolio to showcase your experience (even if you don’t have any), and Section 3 covers how to write your resume.Promote yourself/organization to ~68,500 subscribers by sponsoring this newsletter. 30-35% weekly open rate.
Thank you for joining us this week! :)
Stay Data Science-y!
All our best,
Hannah & Sebastian


Outstanding collection of resources! The curation quality is exceptional - you've put together such valuable insights for the Data Science community. Really appreciate the effort in maintaining this high standard of content week after week. Inspiring stuff! 💡