
Data Science Weekly - Issue 642
Curated news, articles and jobs related to Data Science, AI, & Machine Learning

Issue #642
March 12, 2026
Hello!
Once a week, we write this email to share the links we thought were worth sharing in the Data Science, ML, AI, Data Visualization, and ML/Data Engineering worlds.
And now…let’s dive into some interesting links from this week.
Editor's Picks
What's my JND? – a colour guessing game
You see two colours. Click on the line between them. That’s it. It starts easy. It does not stay easy…Each round the colours get closer together until we find your Just Noticeable Difference - the smallest colour change you can actually see. It takes about 40 rounds. Most people land around 0.02. You might do better. You probably won’t. But hey, prove me wrong…
AMERICA in DATA
America In Data is a project to make raw numbers from spreadsheets more interesting. I hope you enjoy the game and learn something new…22 years of Brain Science: what CoSyNe tells us about the evolution of Neuroscience
Tracking the intellectual DNA of Computational and Systems Neuroscience through its flagship meeting…I downloaded every available Cosyne program book from 2004 to 2026, extracted the abstract text, counted keywords, and identified patterns and trends in the data (all the data and code, including interactive visualizations, can be found here). The results paint a clear picture of a field in transformation. The past, present, and future of Systems and Computational Neuroscience…
What’s on your mind
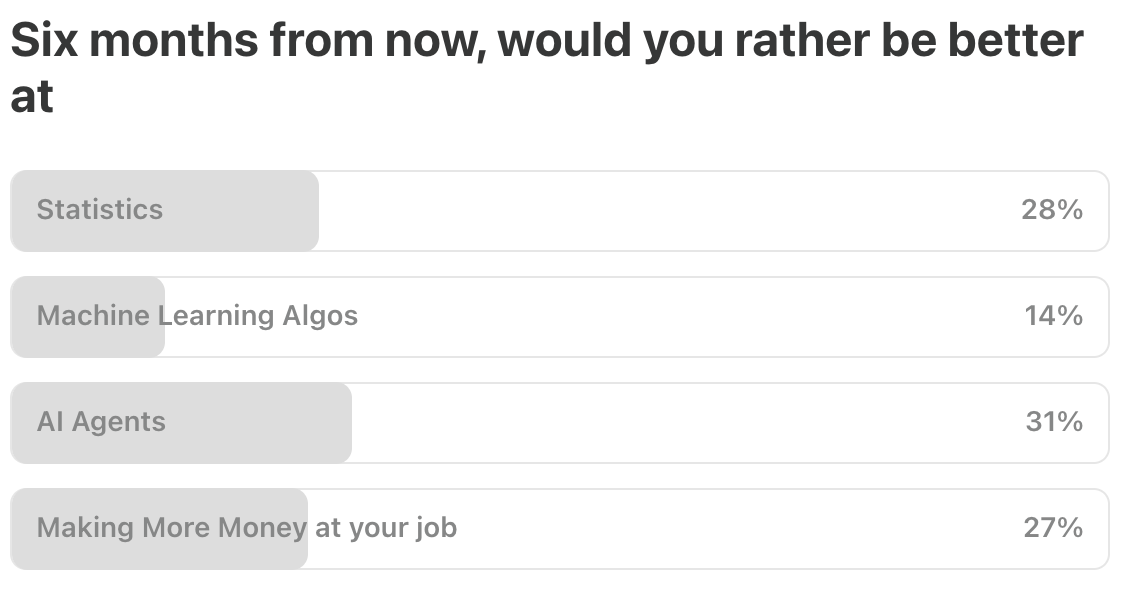
This Week’s Poll:
.
Last Week’s Poll:
.
Data Science Articles & Videos
Learnings from the PyAI conference
I recently spoke at the PyAI conference, put on by the good folks at Prefect and Pydantic, and I learnt so much from the talks I attended. Here are my top takeaways from the sessions that I watched:..Advice on modeling pipeline and modeling methodology [Reddit]
I am doing a project for credit risk using Python. I’d love a sanity check on my pipeline and some opinions on gaps or mistakes or anything which might improve my current modeling pipeline. Also would be grateful if you can score my current pipeline out of 100% as per your assessment :) My current pipeline…
MessyData - Synthetic dirty data generator
Synthetic dirty data generator. Define a schema in YAML, get a realistic messy DataFrame. MessyData generates structured datasets from a declarative config and injects configurable anomalies — missing values, duplicates, invalid categories, bad dates, and outliers. Designed for testing data pipelines, validating data quality tooling, and feeding AI/ML workflows that need realistic imperfect data…Modeling disc golf putting
We use a simple geometrical model and Bayesian statistical analysis to make predictions of disc golf putting success from different distances by professional disc golfers. Player, event, and course data ©2026 PDGA. Based on the geometrical model and Bayesian inference, the putting angle accuracies of top MPO and FPO players are about 1° and 1.4°, respectively…Comparing Python packages for A/B test analysis: tea-tasting, Pingouin, statsmodels, and SciPy
This article compares four Python packages that are relevant to A/B test analysis: tea-tasting, Pingouin, statsmodels, and SciPy. It does not try to pick a universal winner. Instead, it clarifies what each package does well for common experimentation tasks and how much manual work is needed to produce production-style A/B test outputs…Getting to the bottom of TMLE: influence functions and perturbations
I first encountered TMLE—sometimes spelled out as targeted maximum likelihood estimation or targeted minimum-loss estimate—about twelve or so years ago when Mark var der Laan, one of the original developers who literally wrote the book, gave a talk at NYU. It sounded very cool and seemed quite revolutionary and important, but it was really challenging to follow all of the details…I think I have made some progress in developing my understanding, and I wanted to write it down here for my future self (and for anyone else who wants to join along). This post is definitely not a tutorial nor is it literature review. It’s my attempt to encode my understanding of the conceptual ideas that support the underpinnings of the TMLE algorithm…Anomaly detection using surprisals
Anomaly detection methods are widely used but often rely on ad hoc rules or strong assumptions, and they often focus on tail events, missing ``inlier’‘ anomalies that occur in low-density gaps between modes. We propose a unified framework that defines an anomaly as an observation with unusually low probability under a (possibly misspecified) model…Ten years late to the dbt party (DuckDB edition)
I’m rather delighted to say that as of today, dbt has definitely ‘clicked’. How do I know? Because not only can I explain what I’ve built, but I’ve even had the 💡 lightbulb-above-the-head moment seeing it in action and how elegant the code used to build pipelines with dbt can be. In this blog post I’m going to show off what I built with dbt, contrasting it to my previous hand-built method…Claude Code isn’t going to replace data engineers (yet)
I’d already used Claude to teach me dbt, and so I was very curious to see to what extent Claude Code (at the beginning of March 2026) could actually write a dbt project. Not only that, but:
Can Claude build a credible dbt project from real data?
How much help (prompting) does it need; can I just give it the API source, or does it need the analysis work done for it?
What difference do the skills that dbt labs recently published make?
How do the different Claude models perform?
How do you actually evaluate these different factors? (tl;dr crash-course in evals and LLM-as-judge assessment of what was built each time)…
Animal tracking: A curated collection of my blog posts focused on animal tracking analysis
There are numerous tools available for analyzing tracking data. In this post, I share a curated collection of my blog entries that focus specifically on movement analysis, covering from data loading and cleaning to visualizations. Additionally, I’ve included a brief list of papers that can serve as guidance when embarking on tracking studies…What 2,800 AI Conversations Taught Me About My Users
What I learned running topic modeling on 2,800+ user messages, and how you can do it too…I shipped an AI conversation partner for Cantonese (CantoAI) a few months ago…What are people actually trying to accomplish when they use it?…That’s when I turned to topic modeling to help surface the answer. It clusters raw user queries into themes, so you can see which use cases dominate, which segments you’re under-serving, and where your roadmap should go next. Here’s what I found when I ran it on my dataset of 2,800+ user interactions…
How do you deal with bad bosses? [Reddit]
How do you deal with bad bosses?…Preprocessing data with recipes :: Cheatsheet
Posit’s Cheatsheet on getting your data ready for modeling using ‘pipable’ sequences of feature engineering steps with recipes…
.
Last Week's Newsletter's 3 Most Clicked Links
.
* Based on unique clicks.
** Please take a look at last week's issue #641 here.
Cutting Room Floor
Software Review in the Era of AI: What We Are Testing at rOpenSci
BayesFR - Fitting functional responses in 1- and 2-prey systems
.
Whenever you're ready, 2 ways we can help:
Looking to get a job? Check out our “Get A Data Science Job” Course
It is a comprehensive course that teaches you everything you need to know about getting a data science job, based on answers to thousands of reader emails like yours. The course has three sections: Section 1 covers how to get started, Section 2 covers how to assemble a portfolio to showcase your experience (even if you don’t have any), and Section 3 covers how to write your resume.Promote yourself/organization to ~68,750 subscribers by sponsoring this newsletter. 30-35% weekly open rate.
Thank you for joining us this week! :)
Stay Data Science-y!
All our best,
Hannah & Sebastian