
Data Science Weekly - Issue 613
Curated news, articles and jobs related to Data Science, AI, & Machine Learning

Issue #613
August 21, 2025
Hello!
Once a week, we write this email to share the links we thought were worth sharing in the Data Science, ML, AI, Data Visualization, and ML/Data Engineering worlds.
And now…let's dive into some interesting links from this week.
Editor's Picks
AI Doesn't Lighten the Burden of Mastery
Claude wrote me Go tests that passed. They were beautiful, and they were worthless. They all collapsed to true == true. That's the trap. AI gives us the illusion of mastery without the work. The shape of the code looks right, making it easy to skim the details…False mastery is mistaking convincing syntax for real understanding…There's a cultural conversation Software People are having about AI. We're thoughtful professionals, and we try hard to do good work. That's exactly why this false mastery is dangerous: AI makes us feel like we can finally relax and still get good results…
Introduction to Julia for R users
This blog post will give R users an overview of what Julia is and why they might want to use it, introduce some data processing Julia packages, and show how they can incorporate Julia into existing R workflows…Scientists no Longer Find Twitter Professionally Useful, and have Switched to Bluesky
Here we report on the results of a survey distributed to scientists on Twitter and Bluesky (n = 813). Results overwhelmingly confirm that changes to Twitter have made the social media platform no longer professionally useful or pleasant, and that many scientists have abandoned it in favor of Bluesky. Results show that for every reported professional benefit that scientists once gained from Twitter, scientists can now gain that benefit more effectively on Bluesky than on Twitter…
What’s on your mind
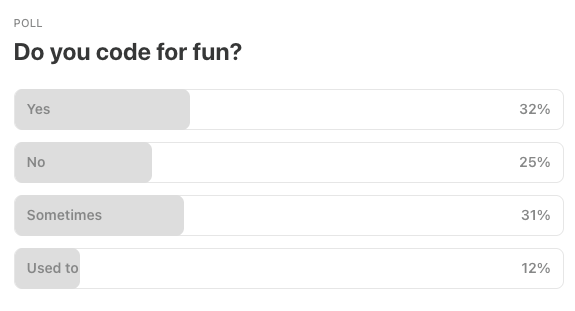
This Week’s Poll:
.
Last Week’s Poll:
.
Data Science Articles & Videos
7 Drop-In Replacements to Instantly Speed Up Your Python Data Science Workflows
Many of Python’s most popular data science libraries—including pandas, Polars, scikit-learn, and XGBoost—can now run much faster on GPUs with little to no code changes…Using libraries like NVIDIA cuDF, cuML, and cuGraph, you can keep your existing code and scale it to handle much larger workloads with ease. This post shares how to speed up seven drop-in replacements for popular Python libraries—complete with starter code to try yourself…A typology of literature reviews: Which review is that? A guide to review types
This quick reference tool provides information on a wide range of literature review types that are available for research synthesis for publication and research purposes…
Thing that destroys your reputation as a data engineer [Reddit]
Does anyone have experiences of things they did as a data engineer that they later regretted and wished they hadn’t done?…A Short Introduction to Optimal Transport and Wasserstein Distance
These notes provide a brief introduction to optimal transport theory, prioritizing intuition over mathematical rigor…Why Optimal Transport Theory?…A fundamental problem in statistics and machine learning is to come up with useful measures of “distance” between pairs of probability distributions…Why Scaling a Database Is Harder Than Scaling a Server
Let’s understand why scaling a database is much harder than scaling a server, with clear examples anyone can relate to…A short statistical reasoning test
Here are a few practical questions of my own invention which are easy to comprehend but very difficult to solve without statistical reasoning competence. They are provided in order of difficulty. The answers are at the end…Bioinformatics courses for beginners
Looking for a bioinformatics course that's perfect for beginners? Look no further! In this video, we'll introduce you some of the best bioinformatics computational biology courses available online. The courses are perfect for people who want to learn about the basics of bioinformatics, from computational methods to sequence analysis. After watching this video, you'll have everything you need to start your journey into bioinformatics!…Absence of evidence and confidence intervals
Here are some statistical interpretation anti-patterns:This study found no significant evidence that X had any effect. Therefore…
(Sub-pattern of the first: because of conservation of expected evidence, this is evidence that the true effect is zero.)
Study A found significant evidence for X, but study B didn’t. Therefore, they disagree or there’s heterogeneity.
There are a couple problems with claims like these…
Basic Feature Engineering with DuckDB
In this post, we show how to perform essential machine learning data preprocessing tasks, like missing value imputation, categorical encoding, and feature scaling, directly in DuckDB using SQL. This approach not only simplifies workflows, but also takes advantage of DuckDB’s high-performance, in-process execution engine for fast, efficient data preparation…
From Facts & Metrics to Media Machine Learning: Evolving the Data Engineering Function at Netflix
Traditional data engineering at Netflix focused on building structured tables for metrics, dashboards, and data science models. These tables were primarily structured text or numerical fields, ideal for business intelligence, analytics and statistical modeling…Enter Media ML Data Engineering — a new specialization at Netflix that bridges the gap between traditional data engineering and the unique demands of media-centric machine learning. This role sits at the intersection of data engineering, ML infrastructure, and media production…Control of Nonlinear Systems Using Denoising Diffusion Models
In this talk, we view classical control and planning problems from the point of view of sampling from a probability distribution. In contrast to classical sampling, the samples in this scenario have to respect constraints imposed by the control system. Denoising Diffusion Probabilistic Models (DDPMs) is a recently introduced method in machine learning for sampling based image generation…
Data Engineering in 2025 - Key Shifts in Pipelines, Storage, and Tooling [Reddit]
Some patterns I’ve noticed across multiple industries:Unified Batch + Streaming Architectures - Tools like Apache Flink and RisingWave are making it easier to blend historical batch data with real-time streams in a single workflow.
Data Contracts - More teams are introducing formal schema agreements between producers and consumers to reduce downstream breakages.
Iceberg/Delta Lake adoption surge - Open table formats are becoming the default for large-scale analytics, replacing siloed proprietary storage layers.
Cost-optimized pipelines - Teams are actively redesigning ETL to ELT, pushing more transformations into cloud warehouses to reduce compute spend.
Shift-left data quality - Data validation is moving earlier in the pipeline with tools like Great Expectations and Soda Core integrated right into ingestion steps…
Mistakes, we’ve drawn a few: Learning from our errors in data visualisation
At The Economist, we take data visualisation seriously. Every week we publish around 40 charts across print, the website and our apps. With every single one, we try our best to visualise the numbers accurately and in a way that best supports the story. But sometimes we get it wrong. We can do better in future if we learn from our mistakes — and other people may be able to learn from them, too. After a deep dive into our archive, I found several instructive examples…
.
Last Week's Newsletter's 3 Most Clicked Links
.
* Based on unique clicks.
** Find last week's issue #612 here.
Cutting Room Floor
Beyond Sensor Data: Foundation Models of Behavioral Data from Wearables Improve Health Predictions
tinytable: a small but powerful R package to draw beautiful tables in a variety of formats
Running OpenAI GPT OSS Locally with Docker Model Runner and R
.
Whenever you're ready, 2 ways we can help:
Looking to get a job? Check out our “Get A Data Science Job” Course
It is a comprehensive course that teaches you everything related to getting a data science job based on answers to thousands of emails from readers like you. The course has 3 sections: Section 1 covers how to get started, Section 2 covers how to assemble a portfolio to showcase your experience (even if you don’t have any), and Section 3 covers how to write your resume.Promote yourself/organization to ~68,500 subscribers by sponsoring this newsletter. 30-40% weekly open rate.
Thank you for joining us this week! :)
Stay Data Science-y!
All our best,
Hannah & Sebastian