
Data Science Weekly - Issue 619
Curated news, articles and jobs related to Data Science, AI, & Machine Learning

Issue #619
October 02, 2025
Hello!
Once a week, we write this email to share the links we thought were worth sharing in the Data Science, ML, AI, Data Visualization, and ML/Data Engineering worlds.
And now…let's dive into some interesting links from this week.
Editor's Picks
Best practices and tools in R and Python for statistical processing and visualization of lipidomics and metabolomics data
This review is intended for those who would like to develop their skills in data analysis and visualization using freely available R or Python solutions. Beginners are guided through a selection of R and Python libraries for producing publication-ready graphics without being overwhelmed by the code complexity. This manuscript, along with associated GitBook code repository containing step-by-step instructions, offers readers a comprehensive guide, encouraging the application of R and Python for robust and reproducible chemometric analysis of omics data…
Can a model trained on satellite data really find brambles on the ground?
Over the summer Gabriel Mahler has been conducting research on hedgehog habitat mapping using Agent Based Models (ABMs) and remote sensing. Hedgehogs seem to like brambles and so as part of his work he has produced a bramble map. He did this by combining the TESSERA earth representation embeddings (using the geotessera library) with data from iNaturalist. The current model is an ensemble of logistic regression and a knn classifier. Can we really see brambles from space? What better way to test the model than a quick field trip around Cambridge. Gabriel, Anil, Shane and I did just that today…The First Decade as Faculty - Looking Back
My first decade as faculty ended in August 2024. Assuming a typical career of four decades, this would mean that I’ve completed the first quarter of my faculty career. So I wanted to share my ten favorite papers from this rather substantial period, with a bit of reflection and backstory…Onto the ten papers; I’ll discuss them in three buckets: visualization (3 papers), spreadsheets (3 papers), and miscellaneous—one paper each on data versioning, dataframes, scalable ML, and notebooks. I will then discuss themes and takeaways from the decade…
What’s on your mind
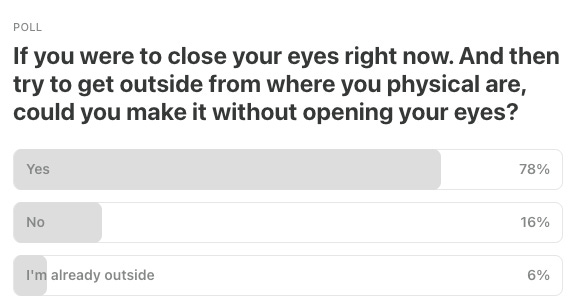
This Week’s Poll:
.
Last Week’s Poll:
.
Data Science Articles & Videos
I Was Wrong: Start Simple, Then Move to More Complex
About four years ago, we released the package DenseClus for clustering tabular mixed data. It seemed like a good idea at the time: take categorical and numeric features, then map them into a lower dimensional space for clustering. Press enter or click to view image in full size Image from Unsplash However, it’s quite intensive…I forgot that the Zen of Python applies to problem solving too…Mine is “always balance the dataset using SMOTE, that will drastically increase the precision, recall, f1 etc”…
Battle-Tested Modeling Techniques for Tabular Data
Over hundreds of Kaggle competitions, we’ve refined a playbook that consistently lands us near the top of the leaderboard—no matter if we’re working with millions of rows, missing values, or test sets that behave nothing like the training data…Below are seven of our most battle-tested techniques, each one made practical through GPU acceleration…torchcurves - A PyTorch module for differentiable parametric curves with learnable coefficients
Parametric differentiable curves with PyTorch for KANs, continuous embeddings, or shape-restricted models…This package provides fully differentiable curve implementations that integrate seamlessly with PyTorch’s autograd system. It streamlines use cases such as continuous numerical embeddings for factorization machines or transformers, Kolmogorov-Arnold networks, or path planning in robotics…ggplot2 styling - So you want to style your plot?
The ggplot2 package has had a recent release that included some relevant changes to styling plots. In ggplot2, the theme system is responsible for many non-data aspects of how your plot looks. It covers anything from panels, to axes, titles and legends. Here, we’ll get started with digesting important parts of the theme system. We’ll start with complete themes, get into theme elements followed by how these elements are used in various parts of the plot and finish off with some tips, including how to write your own theme functions…A Gentle Introduction to CUDA PTX
As a CUDA developer, you might not interact with Parallel Thread Execution (PTX) every day, but it is the fundamental layer between your CUDA code and the hardware…This post serves as a gentle introduction to PTX and its place in the CUDA ecosystem. We will set up a simple playground environment and walk through a complete kernel in PTX. My goal is not only to give you the foundation to use PTX but to also share my mental model of how PTX fits into the CUDA landscape…What’s the most important real-world breakthrough that was driven by statistical methods? [Reddit]
In your opinion, what’s the most important real-world breakthrough that was driven by statistical methods?…An SQL Heuristic: ORs Are Expensive
Query planning is hard. Sometimes. Queries often have more than one filter (using an and clause). But the developer can often end up in situations requiring an or clause…But this is slow! With 1,000,000 applications and 1000 users uniformly distributed on both columns, it takes over 100ms.1 If we rewrite it with only ands…This takes less than 1ms; Over 100 times faster! 12 This is surprising — we have indexes on the filtered columns. But why? First, we need to develop some intuition about how and when indexes are used…A Note on the Dirichlet Distribution
In this post, I explore some properties of the Dirichlet distribution and illustrate the behavior of the symmetric Dirilichet distribution as alpha, the concentration parameter, varies. Understanding this behavior may be helpful in constructing an informative prior for the multinomial distribution…
Why Graphs Are a Natural Fit for Wrestling Data
The 2025 United World Wrestling world championships were held in Zagreb, Croatia from September 13th to September 21st, 2025…It’s the perfect moment to show how graphs uncover wrestling stories that flat tables can’t. At it’s core, wrestling boils down to one metric: who beat whom. That’s a relationship, not a row. Tables flatten it, but graphs preserve it…Using flexdashboard to create a GitHub Actions-powered YouTube feed
I wanted a convenient tool for viewing an aggregated list of videos. I also thought it would be helpful to have the ability to search videos based on presenters, topics, and other criteria…So, I set out to build a dashboard with {flexdashboard} that would display all this information. {flexdashboard} is built on R Markdown, which allowed me to use R to personalize a dashboard with custom colors and styles. And, of course, I used R to pull in the data. {tuber} provides access to the YouTube Data API v3 with R, a straightforward tool for getting the data I needed…
“The G in GPU is for Graphics damnit!”
Adventures in Triton Kernels, Profiling, Parallelism and More…Inside Husky’s query engine: Real-time access to 100 trillion events
At Datadog, we process more than 100 trillion events and billions of queries every day—across logs, traces, network data, and more. To support that scale, we built Husky, our third-generation event store. We detailed its architecture in a series of posts on exactly-once ingestion and multi-tenancy and massively parallel compaction. But all of that engineering—efficient storage, compaction, reliability under bursty traffic—was in service of a single goal: interactive querying at scale…In this post, we’ll explore how Husky’s query engine tackles these problems head-on, and how its architecture enables interactive performance, even under extreme workloads…
.
Last Week's Newsletter's 3 Most Clicked Links
.
* Based on unique clicks.
** Find last week's issue #618 here.
Cutting Room Floor
Building Data + AI Observability Agents with LangGraph and LangSmith
Mathematical Theory of Collinearity Effects on Machine Learning Variable Importance Measures
How important is it for a Data Analyst to learn some ML, Data Engineering, and DL? [Reddit]
.
Whenever you're ready, 2 ways we can help:
Looking to get a job? Check out our “Get A Data Science Job” Course
It is a comprehensive course that teaches you everything related to getting a data science job based on answers to thousands of emails from readers like you. The course has 3 sections: Section 1 covers how to get started, Section 2 covers how to assemble a portfolio to showcase your experience (even if you don’t have any), and Section 3 covers how to write your resume.Promote yourself/organization to ~68,500 subscribers by sponsoring this newsletter. 30-35% weekly open rate.
Thank you for joining us this week! :)
Stay Data Science-y!
All our best,
Hannah & Sebastian