
Data Science Weekly - Issue 659
Curated news, articles and jobs related to Data Science, AI, & Machine Learning

Issue #659
July 09, 2026
Hello!
Once a week, we write this email to share the links we thought were worth sharing in the Data Science, ML, AI, Data Visualization, and ML/Data Engineering worlds.
And now…let’s dive into some interesting links from this week.
Editor's Picks
A visual introduction to information theory
We present a visual, intuition-driven guide to key concepts in information theory. We show how entropy, mutual information, and channel capacity follow from basic probability, and how they determine the shortest possible encoding of a data source and the maximum rate of reliable communication through a noisy channel. Our presentation assumes only a familiarity with basic probability theory…
That’s weird! Anomaly detection using R
This book is about tools and techniques for finding and understanding anomalies. We will begin with some simple data sets containing only one variable, and build up slowly to much more complicated data. We will cover popular but inadvisable methods to identify anomalies (pointing out their shortcomings), as well as more reliable and recommended approaches….Rethinking Validation for Spatial Machine Learning: Takeaways from the Talk
A summary of key points from my keynote and workshop at the Machine Learning for Earth Observation conference in Exeter (2026-06-22 and 2026-06-23)…
What’s on your mind
This Week’s Poll:
.
Last Week’s Poll:
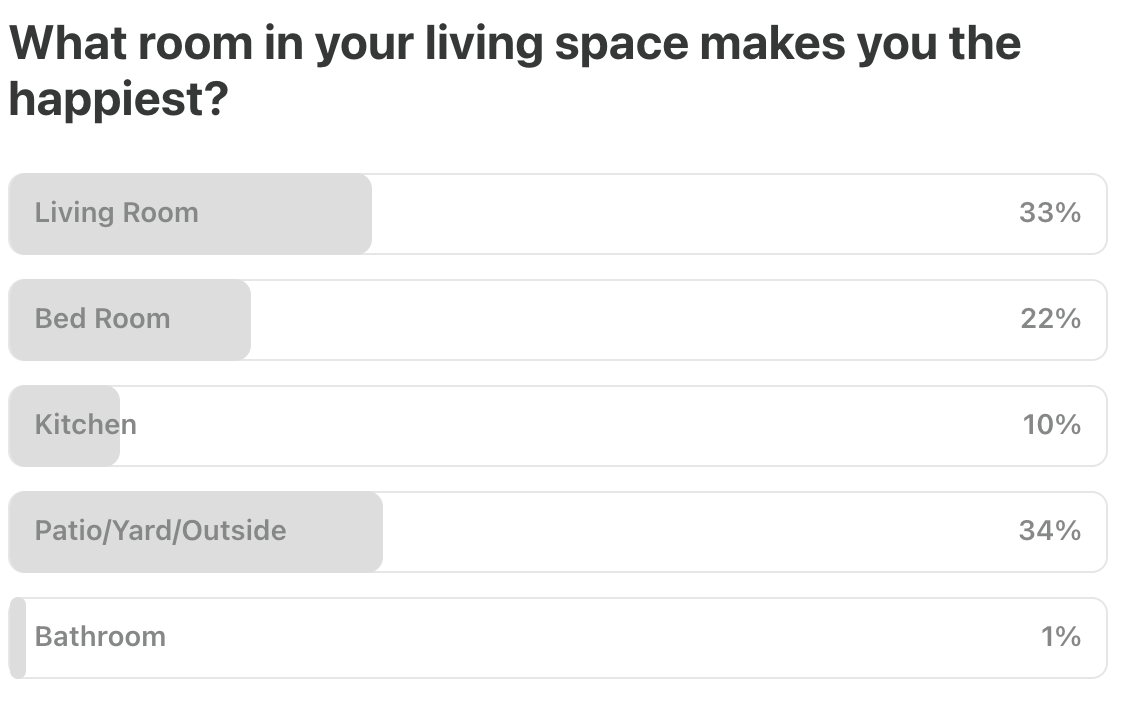
.
Data Science Articles & Videos
Benchmarking Coding Agents on Databricks’ Multi-Million Line Codebase
This article shares the results and methodology of the internal coding benchmark we built at Databricks, which evaluates tools on actual coding tasks our engineers performed on the Databricks codebase. Tasks featured edits against a multi-million line codebase covering many popular languages (Python, Go, Typescript, Scala, etc.) and both tasks and solutions were carefully reviewed to ensure accuracy. This isn’t meant to be comprehensive, but the exercise surfaced insights that have already made our engineering team meaningfully more efficient with coding agents. Below, you can see how models and harnesses scored on the overall benchmark…How much do you actually trust AI output for real reporting? [Reddit]
Feels like everyone’s using ChatGPT/Copilot for something now, but I can’t tell whether it’s mostly “write me a first draft I’ll review” or something people are comfortable using for production reporting after proper validation. Anyone run into cases where AI-generated code looked completely reasonable but was subtly wrong? How much manual verification do you guys still do vs. just running with it?…
Matrix Multiplication on Blackwell: Part 1 - Introduction
In Part 1 (this blog post) we cover what a Matrix Multiplication (matmul) is, its importance for LLMs, and why we need to optimize it. Then we explain what a GPU is, GPU history since Ampere, and finally how to write a simple (not super performant) implementation of matmul on a GPU in 4 lines of Mojo. In part 2, we’ll explain the hardware instructions introduced in Blackwell GPUs, and continue improve on our kernels’ performance to make it leverage the new hardware instructions. As we continue through the blog series, we will incrementally leverage new Blackwell features to improve our matmul implementation until the end of the series where we achieve performance that surpasses that of NVIDIA’s cuBLAS library…Optimal Transport for Actuarial Science
These lecture notes introduce optimal transport as a mathematical language for actuarial science. They treat losses, premiums, scores, reserves, capital scenarios, climate losses and lifetime distributions as probability measures that can be compared, transported, averaged, stressed and interpolated. The first part develops the main tools: couplings, push-forwards, discrete and continuous Kantorovich problems, duality, Wasserstein distances, quantile transport, barycenters, entropic regularization and statistical optimal transport. The second part applies these tools to risk measures, Wasserstein robustness, pricing and capital, portfolio drift, reserving cash-flow distributions, climate-prevention diagnostics, reinsurance, dependence uncertainty, capital allocation, distributional fairness diagnostics and longevity risk…Does additional data always reduce posterior variance?
Additional data does not always decrease the size of a confidence interval. This post will look at this from a Bayesian perspective. In general, new information reduces your uncertainty regarding whatever you’re estimating. The posterior distribution becomes more concentrated as more data are collected. That’s what happens “in general” but does it necessarily happen every time you get new data? Conceivably if you get surprising data, data that is very unlikely given your current prior, posterior uncertainty might increase…
Markdown styling in R plots and tables
There is now a well-established – albeit informal – convention in R of using the “label” attribute as a way of storing natural language descriptions of variables, one that is supported by many packages for visualisation such as ggplot2 and some tabulation packages like table…I’m not entirely sure of the history behind this convention, but from what I can tell it seems to have emerged from the haven and labelled packages, which provide valuable tools built using this idea. For the purposes of this post I’ll keep it simple, and define some simple helper functions that make it easy to set, get and modify the labels associated with a data set…I’m all about ML, but let’s talk about OR
There’s a better way! And I feel like nobody talks about it because the Data’s not Big, you’re not Learning Deep things, and there’s nary a chatbot in sight. It’s boring, old operations research, which was something that I guess your university offered, but nobody really knew what it meant. Full disclosure: I still don’t really know what it means. I do know that the job of the data scientist is to bring value to the company, and having some operations and optimization in your toolbelt is quite valuable!…Samudra 2: A Fast, Cheap AI Ocean Model, Now at the Scale That Matters
M²LInES’ neural ocean emulator now runs multi-year simulations at eddy-permitting resolution on a single GPU, turning a supercomputer-scale job into one you can run hundreds of times over. That opens the door to faster, cheaper ocean information for shipping, fisheries, energy, insurance, and seasonal forecasting…Testing of detection tools for AI-generated text
The study seeks to answer research questions about whether existing detection tools can reliably differentiate between human-written text and ChatGPT-generated text, and whether machine translation and content obfuscation techniques affect the detection of AI-generated text. The research covers 12 publicly available tools and two commercial systems (Turnitin and PlagiarismCheck) that are widely used in the academic setting. The researchers conclude that the available detection tools are neither accurate nor reliable and have a main bias towards classifying the output as human-written rather than detecting AI-generated text. Furthermore, content obfuscation techniques significantly worsen the performance of tools..
patchwork
The goal ofpatchworkis to make it ridiculously simple to combine separate ggplots into the same graphic. As such it tries to solve the same problem asgridExtra::grid.arrange()andcowplot::plot_gridbut using an API that incites exploration and iteration, and scales to arbitrarily complex layouts…Knowledge Distillation Explained, Part 1: How Large Models Teach Smaller Ones
Much of a large model’s capability can be transferred to a significantly smaller model. This is the essence of Knowledge Distillation — a technique where a smaller student model learns from a larger teacher model, aiming to retain most of the teacher’s performance while being faster and cheaper to run…In Part 1 of this series, we trace the evolution of knowledge distillation from Geoffrey Hinton’s foundational 2015 paper through the Transformer era, covering DistilBERT, TinyBERT, and MiniLM…
Managing/ Dealing with Junior Data Scientists? [Reddit]
I’ve been in the ‘data science’ space for a decade+ or so now. One thing I’ve noticed is that generally - give or take - outside of the elite jobs (<2-3% aka not me and almost certainly not you) the caliber of coworkers has declined drastically. I’m not some fabled data scientist. I wasn’t some GitHub nerd who had everything embroil or terminal wizard nor could I write out the math to a GBM on a blackboard. I’d even forget basic obvious statistics. But I felt like I had common sense. Now I’m a manager/director. I work with data scientists. And I’m just generally freaked out by the absolute lack of basic common sense. This is across the last 7 that I have managed. Examples include…Distinguishing variables from parameters
Imagine the following dialog.Professor: f is a function of a real variable x that takes a real parameter k.
Student: What’s a parameter?
Professor: It’s a constant that can vary.
Student: Then if it can vary, isn’t it a variable?
Professor: Sorta, but no not really.
This conversation plays out over and over, and unfortunately it often ends as it does above, with the student confused. Here’s how I believe the conversation should continue…
.
Last Week's Newsletter's 3 Most Clicked Links
.
* Based on unique clicks.
** You can find last week's issue #658 here.
Cutting Room Floor
.
Thank you for joining us this week! :)
Stay Data Science-y!
All our best,
Hannah & Sebastian